This has been an very odd day. I actually woke up without any plans for blog entries and as it turns out, I now have two. Unfortunately it is a situation of the Yang and the Um in the sense that a joyous blog topic was countered with a bummer of an entry. After an internal debate as to which topic to lead with, the decision was made to go with the order in which they occurred in the day. This means we’ll be starting with the happy event. So most of this year was spent rehabbing my messed up hamstring. With the exception of a few important races, there wasn’t a whole lot of opportunity to hit the pavement for any extended time. In fact, after the Bix7 in July I don’t think there was one run over 3 or 4 miles until October. Definitely nothing up to race pace which means it was difficult to keep the weight in check. By the middle of October I’d managed to gain 6 pounds putting me at 166 (one pound over marriage weight and 19 under my martial arts weight). This was pretty depressing and the scale was nagging at me every single morning. Something had to be done. At the same time a friend of mine (Pakage) had made a personal (and probably doctor approved) decision to reduce his weight and had employed an iTouch app called My Fitness Pal to help him do that. I was totally impressed when he showed me this app because it had an extensive DB of foods both from restaurants and grocery stores. Through a simple interface you were able to track your calorie intake, exercise along with a breakdown of key indicators like sodium, fats, vitamins etc. Oh, and the most important thing is …. it was FREE. All this brings us to October 20th when I made the personal commitment to getting myself back in running shape again. There was something coming up the week of Thanksgiving so decided that was going to be the target date to eliminate the unwanted 6 pounds. The software asked me a few questions regarding my lifestyle and goals and set a target calorie consumption of 1710 per day. From October 21st to present I documented every meal, every snack, all drinks and detailed my workouts as much as possible. First thing every morning I stepped on the dreaded bathroom scale and updated the app with the result. Curious as to the results? Let’s cut to the chase and show you the weight graph.
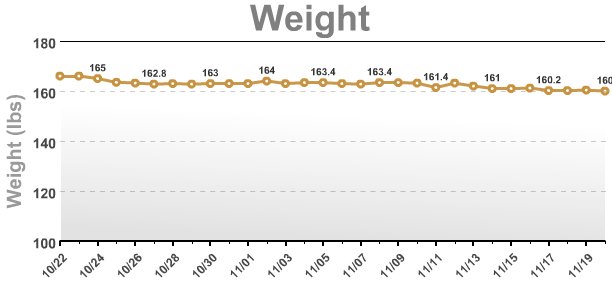
I wish there was a way to change the scale on the myfitnesspal website, but you should be able to tell that the goal was MET! Today’s weight was indeed 160 and even a few days short of the self imposed duration. In celebration I hit McDonald’s on the way into town and ordered sausage and egg bagel and a medium hot chocolate. That was one of the best tasting breakfast sandwiches ever. For now, I’ll transition to maintain mode and with the hammie finally coming around, the runs are already in the 4-5 miles range which means the daily calorie count will need to increase a little. There are some more details after the jump, but a lot of the graphs and such are more for me to analyze how things went. Honestly, this was not the easiest thing for me to do. We eat out a lot which makes healthy choices a little more difficult and there were some sacrifices which led to some frustrating moments. Swapping out my tasty muffins for oatmeal every morning was hard enough, but giving up some of my favorite desserts and reducing the portions on some of my favorite meals was a true test of the willpower. At this point, the hammie feels a lot better, my cardio is getting back to par (think there may have been only 2 or 3 days that I didn’t get a core workout in or a run) and can pretty much work out in the lot for hours and hours without tiring.
Some analytics after the jump
The key stat throughout this project is, of course, the calories. It is a little bit of work to hunt down nutrition details for food items that are not in the DB, but the app provides a pretty easy way to create your own foods.
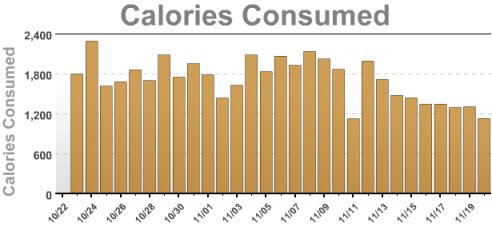
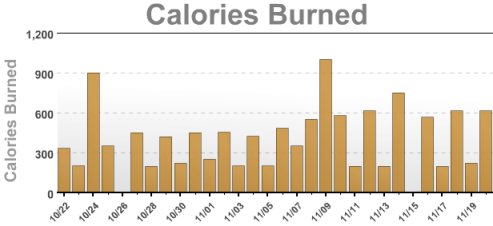
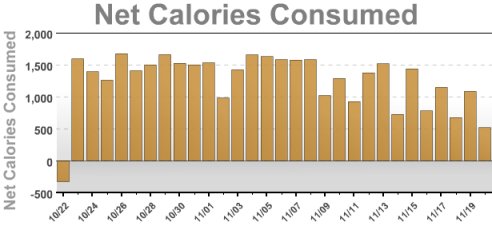
If there is one thing that made the exercise bearable, it was the fact I got to add those calories back into my quota for the day. Trust me, a 600 calorie meal is a whole lot funner than a 300 calorie meal and that little fact will motivate you to keep the sweat going. Netting that all out, you get the following calorie graph.
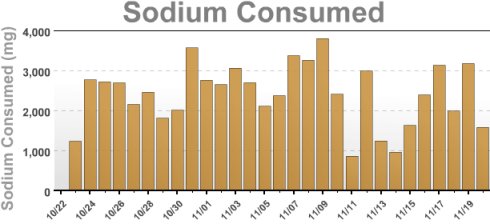
One of the scary realizations during this project was in the realm of sodium. As a couple who tend to eat out a lot, this number is very hard to control. Neither Linda or I add salt to any of our foods (okay, I do add a pinch to cantaloupe but that’s it), but it is definitely a staple in the restaurant menus likely due to its preservative properties. Primary considerations were basic calories, but if there was a close call, I’d try to go with sodium as the tie breaker. Imagine what these numbers would look like if we relied on a salt shaker.
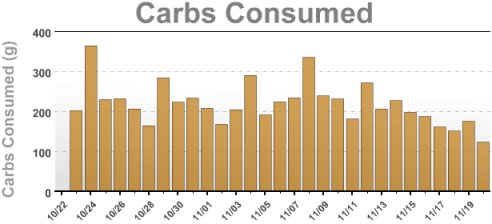
Carbs are always a hot topic in the dieting world. The interesting aspect of this is the conflict this causes with the vitamin benefits of juices. I happen to follow the principle that Vitamin C is the trump card for those nasty cold viruses. Whenever those things are starting to invade, the little C ramps up. Unfortunately, I prefer to get this in the form of juice over the boring tablets which means the carb tallies take a hit. Still worth it in my opinion. Towards the end you will see the graph trending down. This is primary due to switching to more of a milk routine in the morning and relying on Flinstone’s complete as a supplement (yeah, you can laugh if you want, but the other supplements upset my stomach too much and those composites which throw every thing imaginable in them based on obscure studies doesn’t interest me much).
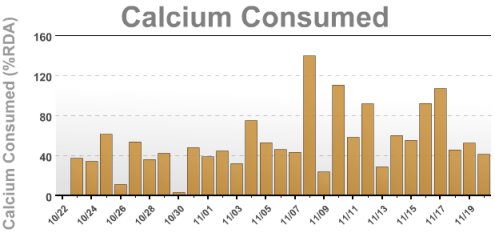
As expected, the extra milk and the purple Wilmas increased the calcium numbers. Not as much as I originally thought, but overall there was a noticeable increase.
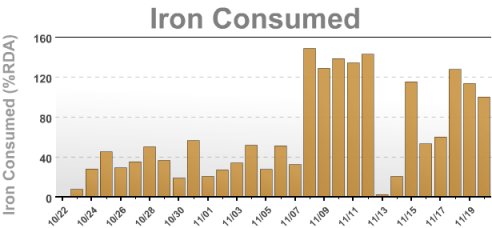
Note, the one downside of adding the orange Barneys was the increase in iron. In general our normal meat intake is sufficient for my iron needs so rarely look for a means to increase that. That area took a definite jump, but so far everything feels okay. I’ll keep an eye on this, but for now will keep it where it is.
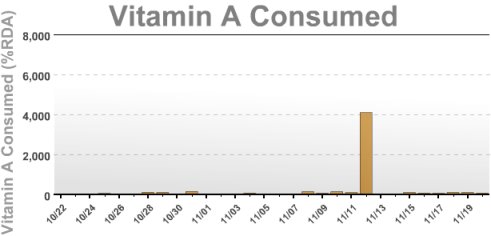
Now, off all the graphs, this one is probably the most intriguing to me. Vitamin A is a bit of a mystery for me in the sense I’m not exactly sure of the benefits, downsides are. The only for sure, is this body isn’t getting much of it at all. Note, the spike is due to probably bad data in the food DB. Not sure what the food was, but one item that day was listed as 4,000% over my daily allowance (me thinks there is an error).
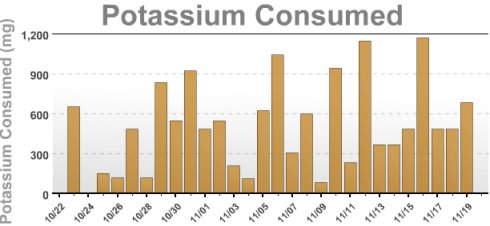
One count that does catch my attention is potassium. As a runner, the P is critical in keeping the muscle cramps down and needs to be replenished after the long runs.
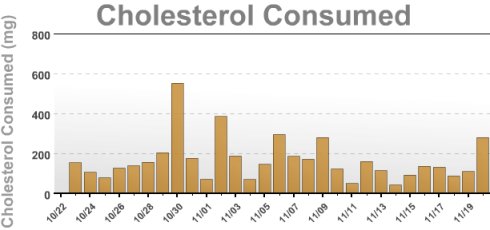
In case you are wondering, all of these graphs were available from the myfitnesspal.com website. Quite nice actually and provides a nice way to summarize all the data you are putting in every day. Here are a few more I captured while I was at it.
Cholesterol:
Fat:
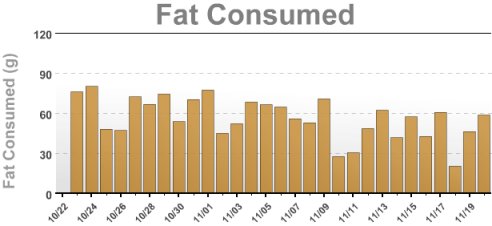
And there you have it, all the vitals you want when trying to reach those weight goals. Again, kudos to the creators of this app and website for providing all these tools. At first I was confused as to why this app was free. With some noodling, it became very obvious to me. This data is a gold mine for market research. All they wanted was my zip code from a profile perspective, but that is a key indicator. With that location attribute, the market firms can quickly identify what restaurants are popular in the region, what are the most popular food items, are there trends in a given region that can be leveraged for competing products – an analytic’s orgasm to be blunt about it. I’m benefiting from their app and they are benefiting from my data. At this point, it’s a fair trade in my book.
That’s about it. Another successful experiment in the books.. whoops, on that probably should be in the blog!

